|
Protocol
for DNA Quantitation Using Hoechst 33258 Dye
1.
INTRODUCTION
Quantitation
of DNA is a prelude to many practices in Molecular Biology.
Common techniques that use DNA, such as sequencing,
cDNA synthesis and cloning, RNA transcription, transfection,
nucleic acid labeling (e.g. Random prime labeling),
etc., all benefit from a defined template concentration.
Failure to produce results from these techniques can
sometimes be attributed to an incorrect estimate of
the DNA template used. DNA concentration is measured
by UV absorbance at 260 nm (1A260 = 50 µg/mL)
in a 1cm path length cuvette.
The
Picofluor™ fluorometer can be used for DNA
quantitation along with Hoechst 33258 Dye, a bisbenzimide
DNA intercalator that excites in the near UV (350 nm)
and emits in the blue region (450 nm). Hoechst 33258
Dye binds to the AT rich regions of double stranded
DNA and exhibits enhanced fluorescence under high ionic
strength conditions. Sensitivity of the Hoechst 33258
Dye assay is approximately 10 ng/mL. The linear dynamic
range extends over 3 orders of magnitude from 10 ng/mL
to 1 µg/mL DNA.
2. MATERIALS REQUIRED
- Picofluor™
Laboratory Fluorometer with UV optical configuration
(P/N 8000-003)
- 10mm
x 10mm Methacrylate fluorescence cuvettes (P/N 7000-959).
- FluoReporter
Blue Fluorometric ds DNA Quantitation kit (Molecular
Probes F-2962)
-
Calf Thymus DNA (P/N 3600-941)
- TE
buffer for dilution
- 0.45µm
filtered water
3.
FACTORS TO CONSIDER
3.1
Calf Thymus DNA can often serve as a reference
for most plant and animal DNA because it is double-stranded,
highly polymerized, and is approximately 58%AT (42%GC).
For bacterial DNA, a different standard may be needed
because the AT% varies widely depending on species.
3.2
The conformation (supercoiled, relaxed, circular,
linear) of plasmid DNA may result in different Hoechst
33258 Dye binding efficiencies. Thus, it is important
to select a standard with similar physical characteristics
to your sample. The most stable form is linear.
3.3
Hoechst 33258 Dye fluoresces only about half as much
when it binds to single-stranded genomic DNA compared
to when it binds to double-stranded genomic DNA. In
addition, short pieces of single-stranded DNA will
not normally cause Hoechst 33258 Dye to fluoresce
in proportion to their concentration.
3.4
Buffers commonly used to extract DNA from whole cells
have little or no effect on this assay. Low levels
of detergent (<0.01%SDS) have little or no effect
on this assay.
3.5
Salt concentrations up to 3 M NaCl do not affect this
assay. For peak fluorescence, at least 200 mM NaCl
is required for purified DNA and 2.0 to 3.0 M for
crude samples. In crude samples, higher salt concentrations
appear to cause the dissociation of proteins from
DNA, allowing the dye molecules to bind easier to
DNA.
3.6
RNA does not interfere significantly with the DNA
assay because Hoechst 33258 Dye does not normally
bind to RNA. Under high salt concentrations, fluorescence
from RNA is usually less than 1% of the signal produced
from the same concentration of DNA.
4. SOLUTION PREPARATION
4.1
Hoechst 33258 Dye stock dye solution:
NOTE:
Hoechst 33258 Dye is a possible carcinogen and possible
mutagen. Wear gloves and a mask, and work under a
fume hood.
Dilute
100 ul Hoechst 33258 Dye with 100mL TNE buffer (Molecular
Probes F-2962). The reagent may be refrigerated if
not required immediately. This will be sufficient
for 700 samples blanks and standards.
4.2
Calf Thymus DNA Standard: (0.2 A260 = 10 µg/mL).
Prepare 4mL of 100-fold diluted (100 ng/mL) stock
solution. Dilute with 1X TE to desired concentration
as described in Table 1.
Table
1. Protocol for preparing a low range standard curve
using Calf Thymus DNA Standard.
|
Vol.
(µL) of 100ng/mL DNA stock*
|
Vol.
(µL) of TE
|
Vol.
(µL) Diluted Hoechst reagent
|
DNA
conc. (ng)
in cuvettes
|
|
1000
|
0
|
1000
|
100
|
|
600
|
400
|
1000
|
60
|
|
500
|
500
|
1000
|
50
|
|
400
|
600
|
1000
|
40
|
|
300
|
700
|
1000
|
30
|
|
200
|
800
|
1000
|
20
|
|
100
|
900
|
1000
|
10
|
|
50
|
950
|
1000
|
5
|
|
20
|
980
|
1000
|
2
|
|
0
|
1000
|
1000
|
0
|
0 �g/mL
0 �g/mL
5. PROTOCOL FOR GENERATING A STANDARD CURVE
Generating
a standard curve verifies the linearity of the assay
within a particular concentration range.
NOTE:
Accurate pipetting and thorough mixing is critical
for reproducible results. However, take extreme care
when mixing samples; do not introduce air bubbles.
Air bubbles can cause scattering of light leading
to inaccurate results. If air bubbles form, hold the
upper portion of the cuvette in one hand and gently
tap the bottom sides of the cuvette with your other
hand to release bubbles.
Set-up
the Picofluor™ fluorometer per instructions
in the user's manual. Power up the instrument by pressing
the [ON/OFF] button. Use the [A/B] button to toggle
to the "UV" channel. Press [STD VAL] to
program in the concentration of your calibration standard.
We suggest calibrating with 100 ng of DNA std. Use
the up and down arrows to set the concentration value.
Hold down the arrow key to activate faster scrolling.
When ready, press the [CAL] button to start the calibration.
The Picofluor's screens will lead you through
the calibration process.
Measure
the fluorescence of the remaining standards to generate
a standard curve of fluorescence versus DNA concentration.
Figure 1 illustrates the background subtracted fluorescence
values (Y- axis) and DNA (ng/mL) (X-axis).
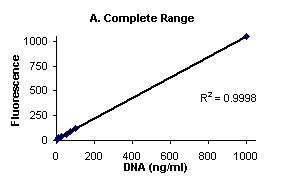
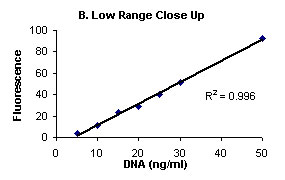
Figure
1. Complete range (A), and low range close up (B)
Calf Thymus DNA stained with Hoechst 33258 Dye and fluorescence
measured on Turner BioSYstems Picofluor™
Laboratory Fluorometer.
6.
SAMPLE ANALYSIS
Dilute
the experimental DNA solution in TE to a final volume
of 1mL and add 1mL of the Hoechst working solution
(prepared in section 4.1) to achieve a final volume
of 2.0 mL. You may wish to use two or three different
dilution factors for a given sample.
Measure the fluorescence of each sample using the
same calibration conditions as used to generate the
standard curve (as in section 5). Determine the DNA
concentration of each sample from the standard curve
generated in section 5.
7.
REFERENCES
1.
J Histochem Cytochem 24, 24 (1976).
2. Anal. Biochem. 102, 344 (1980).
3. Anal. Biochem. 131, 538 (1983).
4. Anal. Biochem. 191, 31 (1980).
5. Methods Enzymology 58,141 (1979).
|